HR Analytics Dashboard

Objective
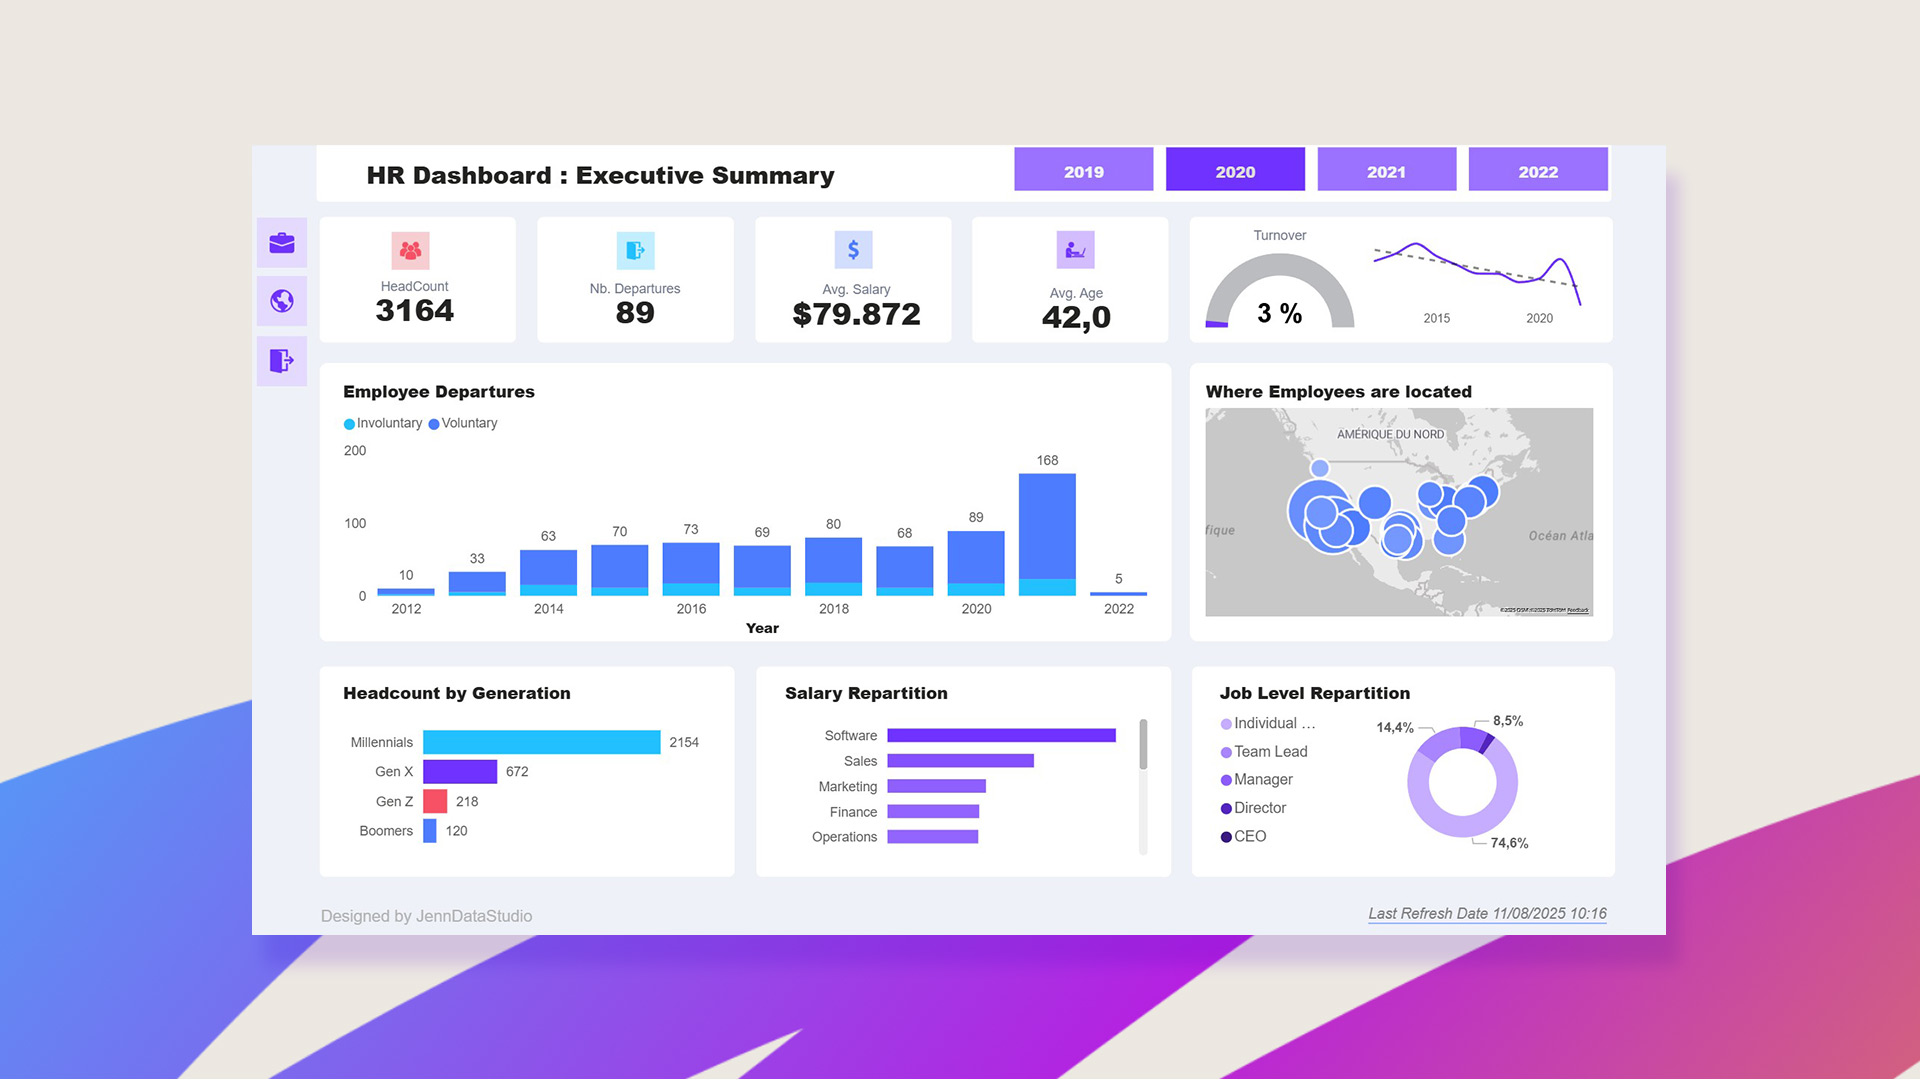
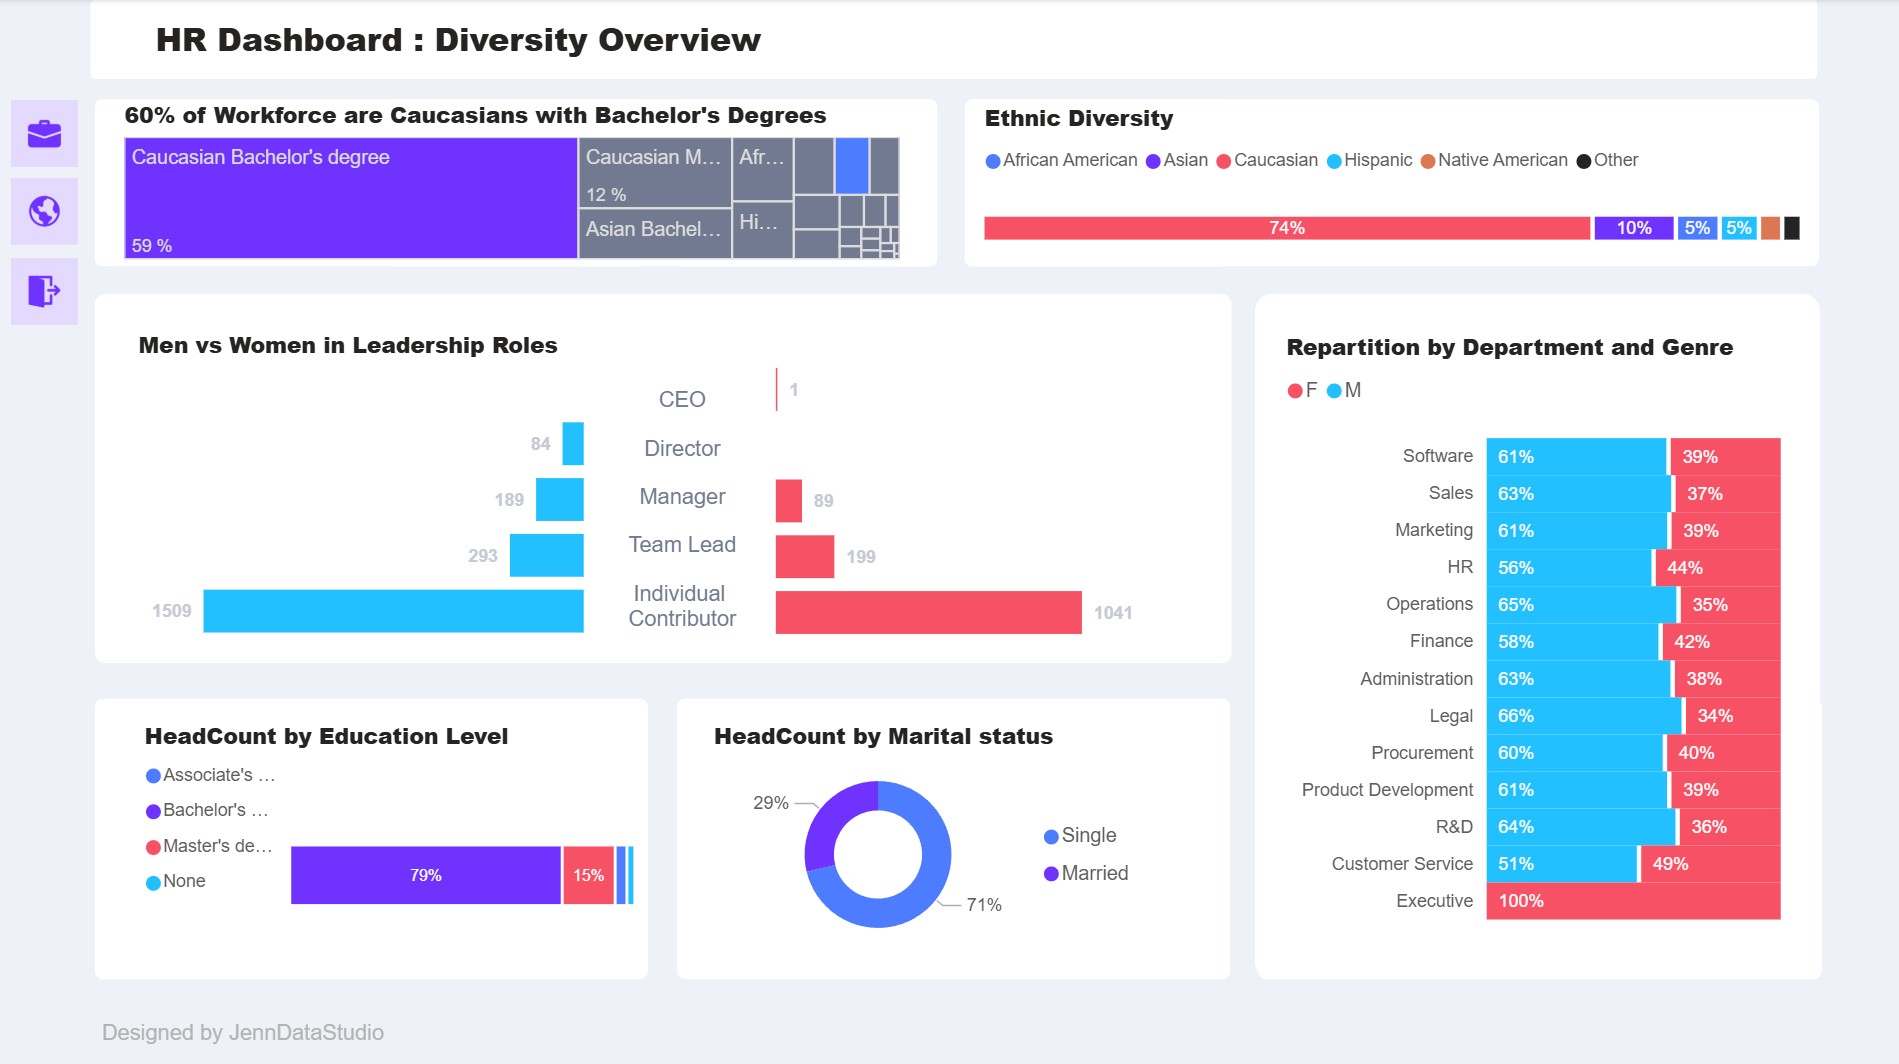
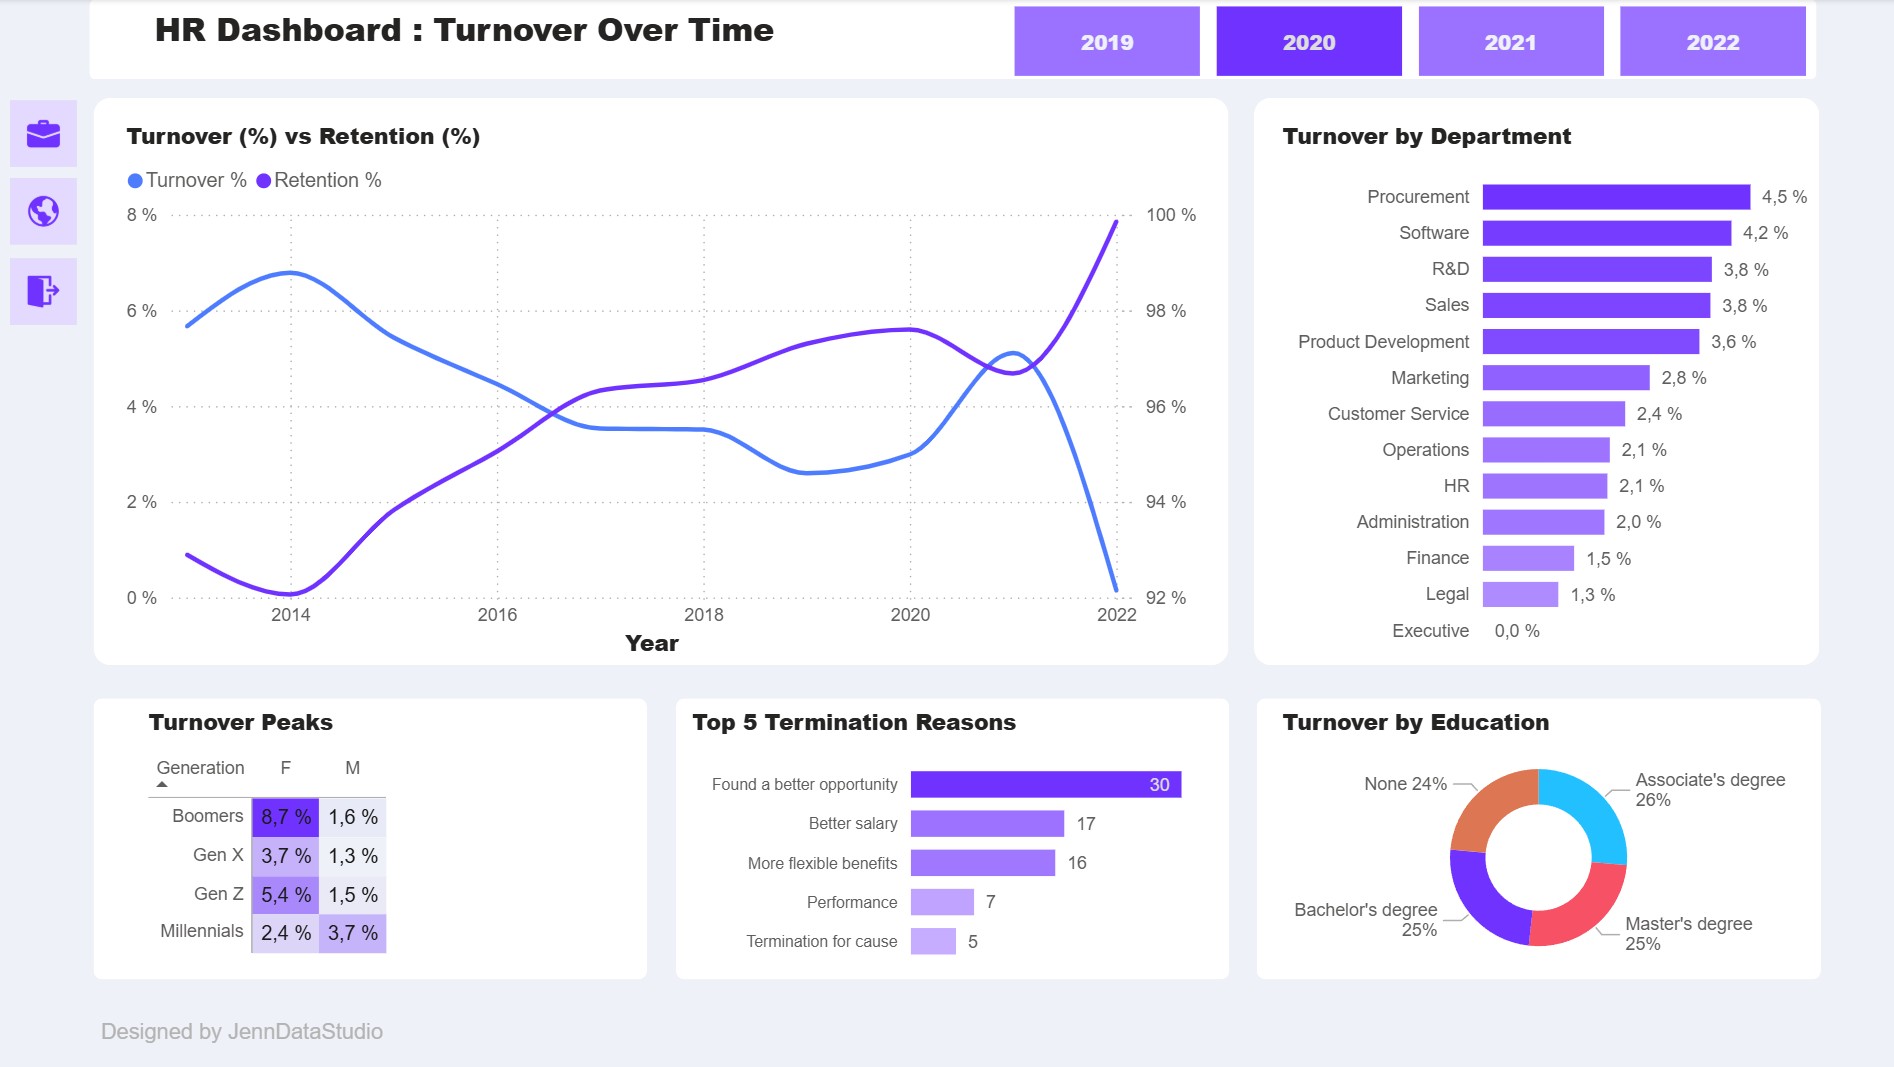
Design an intuitive dashboard to provide HR teams with a clear and concise overview of key workforce metrics—headcount, diversity, and turnover—enabling faster, data-driven decisions.
Audience
Targeted at experienced HR professionals who require quick access to actionable insights without distractions or unnecessary complexity.
Data & Sources
This dashboard is built on anonymized HR data covering 10 years of the lifecycle of a fictitious company based in the USA, with a workforce of approximately 1,400 employees. The source files are CSVs, which were used to design a star schema data model. Advanced DAX measures were implemented to enable dynamic calculations and in-depth analysis across key HR metrics such as headcount, retention and turnover.
Solution
Developed with a strong focus on UI/UX design, using a carefully chosen color palette and clean layout to maximize readability and reduce cognitive load. Interactive charts and filters, combined with a streamlined navigation menu, allow users to explore data deeply and effortlessly.
Impact
This dashboard transforms complex HR data into a user-friendly tool, improving reporting efficiency and empowering HR teams to spot trends and act proactively.
Tools & Techniques
Built with Power BI, complemented by Adobe Photoshop for icon design and mockup creation, applying best practices in data visualization and UX design to deliver an engaging and polished user experience.
Live Dashboard Demo
Experience the Interactive Visualizations and Navigate the HR Data Yourself
Ready to turn your data into decisions?
Tell me more about your project and needs.
JennDataStudio
contact
Links
Curabitur non nulla sit amet nisl tempus convallis quis ac lectus. Nulla porttitor accumsan tincidunt. Curabitur


